Who Does a Diesel Export Ban Actually Save? Jan Stuart on the Spreads Nobody Is Reading
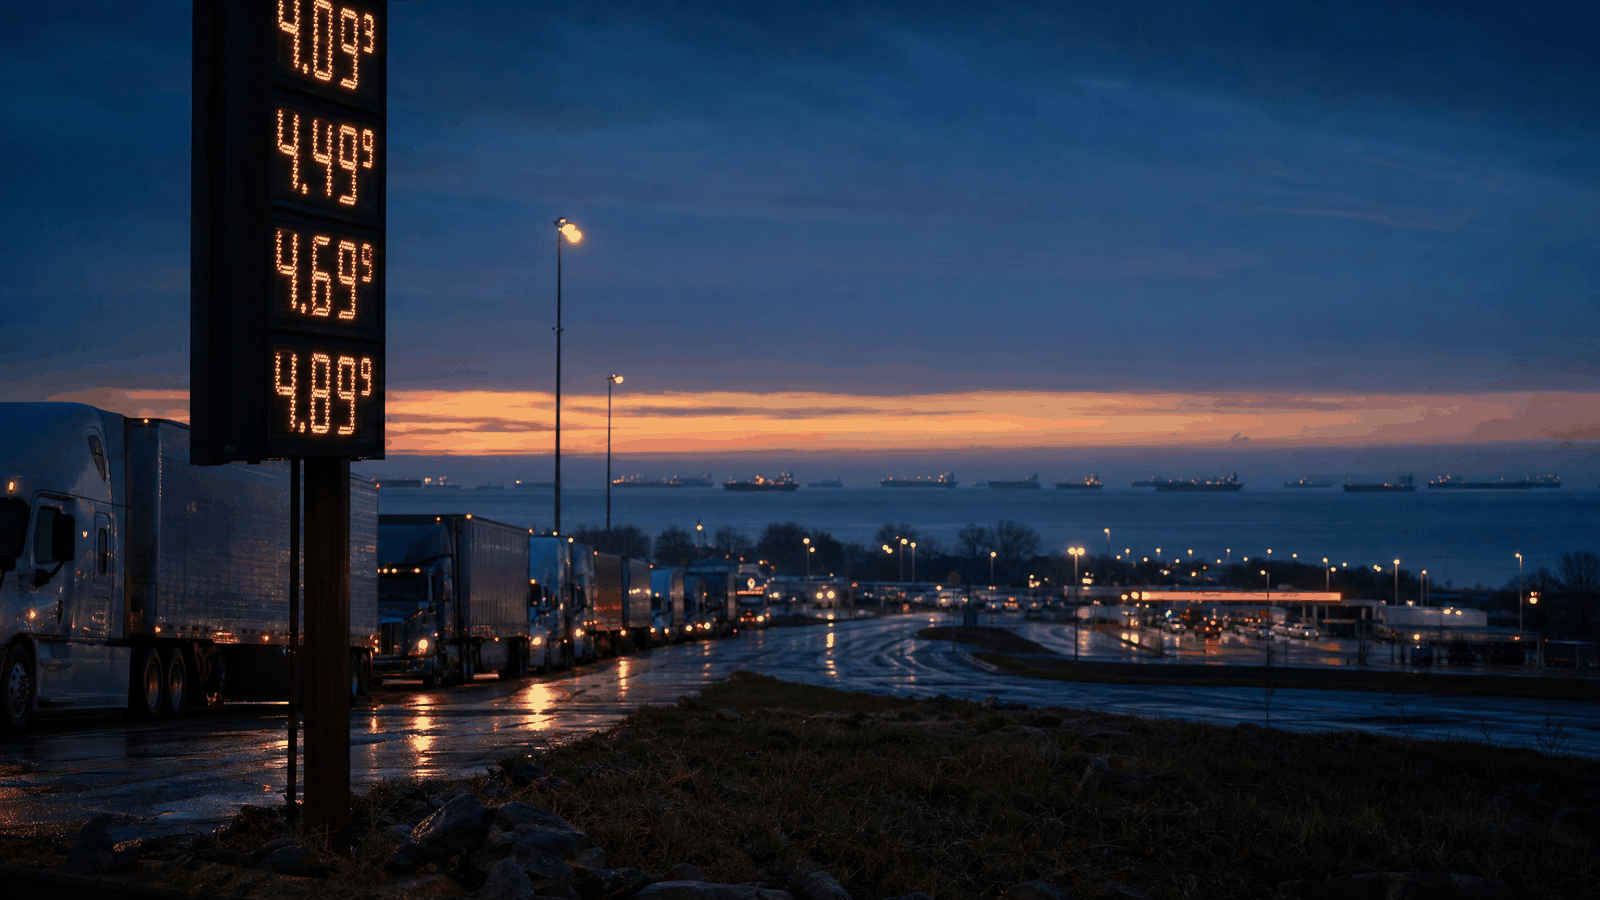
Notes on the 2026-09-25 Columbia Energy Exchange Iran Conflict Brief, where Piper Sandler's Jan Stuart unpacks loadings data, tanker rates, and the chain of costs behind a US diesel export ban. Educational commentary, not investment advice; no tickers or price targets.
Contents
Blood on the frontier runs deep as the sea, and the Emperor’s appetite for expansion has not stopped.
—— Du Fu, “Ballad of the War Chariots” (Tang, c. 751; translated by the author)
On the Iran Conflict Brief recorded 25 September 2026 — a limited series from the Columbia Energy Exchange — host Daniel Sternoff brought in Jan Stuart, global energy strategist at Piper Sandler, to open up seven months of oil market damage. Jan said he had given up on published Hormuz transit numbers: he buys three data sets and all three conflict, so he works from daily port loading reports instead, where the seven-day average is still 5 million barrels per day below the 2025 baseline. That day Brent traded at $105, down from April’s $126 peak, while US diesel cracks sat near $100 a barrel, retail diesel topped $6.50 a gallon (up 85% from pre-war), and a Middle East-to-Asia VLCC cost twenty times its pre-war rate. He figures an export ban could pull US pump diesel down a dollar or two, at the cost of pulling 1.5 million barrels per day out of a global seaborne diesel trade that has already shrunk to 6 million. All of that holds only while the war does: on a year-end ceasefire, he models a 4 million barrel per day surplus in 2027 and an average price starting with a six.
What this episode covers
This is a limited series devoted to the Gulf crisis. On recording day, US and Iranian officials had just held their first indirect contact in New York since the July memorandum of understanding collapsed, with no sign either side wants to concede. Iran’s ports are blockaded and its crude exports sit near zero. Arab Gulf flows have partly recovered behind US naval escorts and dark transits hugging the Omani coast, bouncing between 6 and 10 million barrels a day against a pre-war 20 million of crude plus products. The Houthis, who sat out the first phase, have closed Bab al-Mandeb, and strikes on the East-West Pipeline took out Saudi Arabia’s main bypass around Hormuz.
Sternoff opened with the frog in slowly boiling water: spot crude looks calmer while products, tankers and the futures curve all scream. Jan is the right guest for that texture. He was a journalist in the 1990s, started at the International Energy Agency in Paris, built energy franchises at Credit Suisse, Macquarie and UBS, and bikes across New York in any weather while carrying the price of every crude grade and every product in his head.
The points worth keeping
One: he trusts loadings, not transits. Jan’s view is that the only people who know how many tankers pass and what is on them are the US Navy. So he takes daily loading readouts by port around the Persian Gulf and the wider Middle East, and watches seven-day moving averages to see what flow is actually sustained. That method caught September’s turn immediately: zero loadings out of Yanbu for ten straight days after the East-West Pipeline was partly destroyed, with disruptions there even before that. Iraqi loadings inside Hormuz jumped, Kuwait less so, Saudi Arabia only very lately, and the net shortfall still comes to 5 million barrels per day of crude. At the height of the conflict, before the workarounds started working, it was 12 million.

Two: inventory is being eaten by voyage length. His team finally built a crude balance that balances, and it shows September through December averaging 3 million barrels a day short, with December worse. What does a shortfall look like in practice? Jan gave the arithmetic: Yanbu to Asia direct is ten days; around Africa it is twenty-nine. Those nineteen extra days times whatever sits on the tankers becomes what he calls inventory in use — oil in transit at sea. The barrels still exist; they have been moved away from the places that need them, while refiners grow anxious about the next cargo and bid up spot for the same crude. That is the engine behind a front barrel trading almost $7 over next month’s.

Three: a quarter of the diesel madness belongs to shipowners. Sternoff read the screen: VLCC rates from the Middle East Gulf to Asia around $200 a tonne against a pre-war $10–15, roughly a million dollars a day for the ship, adding $25–30 a barrel on top of already expensive crude. Jan said he spends his life on oil markets and refuses to touch tanker markets, then pointed at something that does not add up: a tanker sailing from the US Gulf to Asia has no reason to carry a war premium. A ship going up to Basra through Hormuz needs serious insurance, fine. The rest of the fleet pricing like this, he said, begs investigation by people more qualified than he is. His suspicion lands on ownership concentration — a Korean outfit that bought an enormous number of tankers in January, plus Saudi, Emirati and Norwegian fleets — which lets rates go, in his words, stratospheric. Then he traced where the cost lands. A US Gulf Coast refiner takes a barrel off a pipeline, puts diesel on a boat, and earns about $110 a barrel. But the marginal diesel price is set by a hydroskimming refinery in Europe that buys its crude off the ocean at a steep price with $25 of tanker rate embedded, runs inefficiently, and pays expensive labour. “So 25% of the silliness in diesel prices can be laid at the feet of the tanker owners.”
Four: if you are going to do something silly, there is a calendar for it. This is the sharpest stretch of the episode. Jan said he tried to explain it to his kids: the first way to fix diesel is not to get into a stupid war. He mentioned becoming a US citizen, which lets him be rude about American politicians now. On the midterms, he noted that any political consultant will tell you the best window to move an election with fuel prices is six to four weeks out — exactly where we are — both for maximum effect and to shorten the time in which adverse secondary effects can come home to roost. So if the country is going to ban diesel exports, he said, do it before the end of next week and hope truckers and farmers forget everything else. He also flagged why Midwest diesel runs hotter: two big PADD 2 refineries are down for maintenance in a region that already drew down a ton of diesel inventory. He said “I assume that was not willfully timed,” then corrected himself — of course it was not, that work is planned quarters ahead — and that self-correction tells you more than any forecast.

Five: the bill reappears from a different pocket. By their math, an export ban strands 1.5 million barrels per day of diesel that must urgently find customers and storage. Once storage fills, refiners shift yields toward other products or cut runs. Cutting runs deepens the gasoline import requirement, so you suppress diesel and raise gasoline, annoying a different slice of the electorate a few months later. Globally it looks worse: he counts over 4 million barrels a day of refining capacity offline, a seaborne diesel trade down from 7 million to 6 million, and removing 1.5 million from that would send Europe into crisis, strand Latin American importers who hold no strategic diesel reserves, and push Asian buyers to beg Japan and Korea for cargoes. Whether the Trump White House cares is debatable, he said; he argues it should. On China as a fix, his answer was flat: no. He kept returning to an April Economist cover — a blurred, agitated Trump in the foreground, a beatific Xi Jinping behind him, the caption reading “don’t interrupt your enemies when they’re making mistakes.” Expect a few judicious, small, targeted cargoes to buyers in dire straits, nothing at scale.

Six: most demand loss is suppression; a slice of it never comes back. Jan sees little structural change from the war. Price changes behaviour, but turning that into what truck you buy has not happened yet. He also distrusts the data: Europe was meant to release 100 million barrels of strategic diesel and the IEA numbers show 2 million released across April to July; German diesel demand supposedly fell 10% without a recession, which does not survive contact with what he knows about European trucking. He admitted that complaining about data always sounds like an excuse, and said there is still too much strangeness in it. What is structural sits in chemicals: naphtha crackers in Korea, Japan, Singapore and Taiwan cannot get Middle East naphtha, competitors with other feedstocks are taking their share, and some of those crackers will close for good, with part of the slack picked up by ethane and propane crackers in China and the US. The other accelerant is electric vehicles — sales jumped through the second quarter and into July and August, strongest in Europe but also Brazil, Mexico and Australia, restarting a trend that had slowed in 2024 and 2025. For the full year he expects global demand down about 1.5 million barrels a day, a number that normally requires a global recession.
Seven: he bets the US cracks first. On a year-end settlement with unfettered Hormuz transit, Saudi, Iranian and Iraqi wellhead production flowing, Americas growth of 1.3–1.4 million barrels a day from Canada to Argentina, and Middle East spare capacity back in the market, he gets a 4 million barrel per day surplus. Even with demand rebounding from minus 1.5 million this year to plus 2.5 million next, mandated strategic refills absorb only about 800,000, so 2027 averages a six handle. Without a settlement, a 5 million barrel per day molecule deficit cannot run another 400 days, so something breaks — and his question is who cracks. He answers the United States and its allies, not Iran: the regime is more solid, fully backed by Beijing and to a lesser degree Moscow, playing a long game for regional sway. It does not need to own Riyadh, only to regulate traffic and commerce through the Gulf, which he described as a supercharged OPEC that both levies tolls and decides which barrels may not flow. In that world he sees 2027 spot with an eight or nine handle and mid-cycle WTI above $75. His closing line offered nothing comfortable: there would be friction first, it would not be pretty, and the consequences would be historic.

Where this leads
When three data sets disagree, who do you believe
Hearing Jan say he buys three data sets, all three conflict, and he hates it, I thought about my own notes on shipment volumes, market share and industry size — three sources, three numbers, and I quietly pick the one that fits the story. His answer was not to take the median. He walked one step upstream: everyone else estimates strait transits, so he goes for the record of which port, which day, how many ships, how much oil, because that is the link somebody has to write down accurately to do business.
That move transfers directly. For any number you are about to treat as a conclusion, ask who recorded it and why, whether they had an incentive to get it right, and whether a record closer to the event exists. Upstream of a revenue estimate sit shipments and orders; upstream of shipments sit capacity and scheduling; upstream of market size sit the output of a handful of critical suppliers. Get to the layer where someone must be accurate to collect money or clear customs, and the number stops wobbling.

Jan added one more safeguard: seven-day averages, because a single day gets distorted by weather or one ship’s schedule. He wants flow that is sustained, which is the same question we ask about a company’s momentum — a single month’s surprise is often shipment timing, and the trend lives in the rolling figure.
The price cooled; the pressure did not leave
Brent went from $126 to $105, so a headline can say oil has eased. On that same day, diesel cracks ran near $100, tanker rates at twenty times normal, front month $7 over next month. This is the part of the episode I keep returning to: a single price is an average that compresses every location, every date and every grade into one number, while the strain lives in the spreads.

Each spread says something different. The crack says the tightest link is turning crude into usable diesel, which is why truckers and farmers feel it before car drivers do. The freight rate says the tightest link is moving oil from where it is to where it is used, and it sneaks into a European marginal refinery’s cost before becoming everyone’s diesel price. Backwardation says the market wants barrels now and does not want them next month, which is the market confessing it has nothing on hand.
Looking at my own holdings, I fix on one headline number: price, multiple, market cap. This episode nudged me to add a layer of spreads — the gross margin gap between the best and worst operator in an industry, the price gap between a company’s new and old products, the gap between a company’s realised price and the spot index. The headline number tells you the mood; the spread tells you which link is carrying the load, and that link is usually where the breaking or the earning happens first.
Policy makes you comfortable and mails the bill elsewhere
Jan did not take a moral position on the export ban. He itemised the bill instead: pump diesel from $6.50 to maybe $4.50, paid for by 1.5 million barrels a day needing domestic homes, storage filling, yields shifting, runs cutting, gasoline rising, a different group of voters unhappy months later, and buyers in Europe, Latin America and Asia absorbing the gap. Add his line about the six-to-four-week window shortening the time in which side effects come home, and the shape is visible: the cost is relocated to another pocket and another date.
That is a useful lens for any policy or corporate decision. When a measure makes people exhale, ask whose cost moved, onto whom, and when it arrives. An inventory write-down flatters this year and moves the cost into next year’s margin. A subsidy flatters demand and moves the cost into the fiscal account. Deferred maintenance flatters output and moves the cost into a later outage. The question needs no forecasting skill, only the willingness to look two squares further ahead.
Worth a look
- The Iran Conflict Brief, a limited series from Columbia Energy Exchange, produced by Columbia University’s Center on Global Energy Policy; the 2026-09-25 episode is Daniel Sternoff interviewing Jan Stuart of Piper Sandler
- EIA weekly retail diesel prices and refinery utilisation, the fastest public way to check which segment the diesel pain sits in
- The IEA monthly Oil Market Report, useful against Jan’s doubts about strategic releases and reported demand
- The crude forward curve on any exchange: the front-to-next-month spread lets you judge scarcity yourself
One thing to take with you
Averages mislead; gaps do not. The whole episode demonstrates it. Brent at $105 says things are manageable, while the crack, the freight rate and the front-month premium all shout at once. One aggregate number hides who is hurting; the distance between two ends reveals it.

Here is something I have tried that works outside markets too. Take one thing you think is fine, stop looking at its average, and write down its two ends instead. Your average monthly household spend, then the most expensive month. How often you typically talk to someone who matters, then the longest gap you have actually gone. Your average nightly sleep, then your shortest night. Put both numbers on the same line and see how far apart they sit. If the gap is small, the “fine” is real; if it is wide, the average you have been resting on has smoothed over a stretch that was not holding.
This article is an educational discussion of investment method. It is not advice to buy or sell any individual security, offers no target prices, and does not analyze any current holding. Investing carries risk; make your own decisions or consult a qualified professional.