Bipartisan Data Center Backlash, Underestimated Solar, an Underrated Grid: Notes on a Catalyst AMA
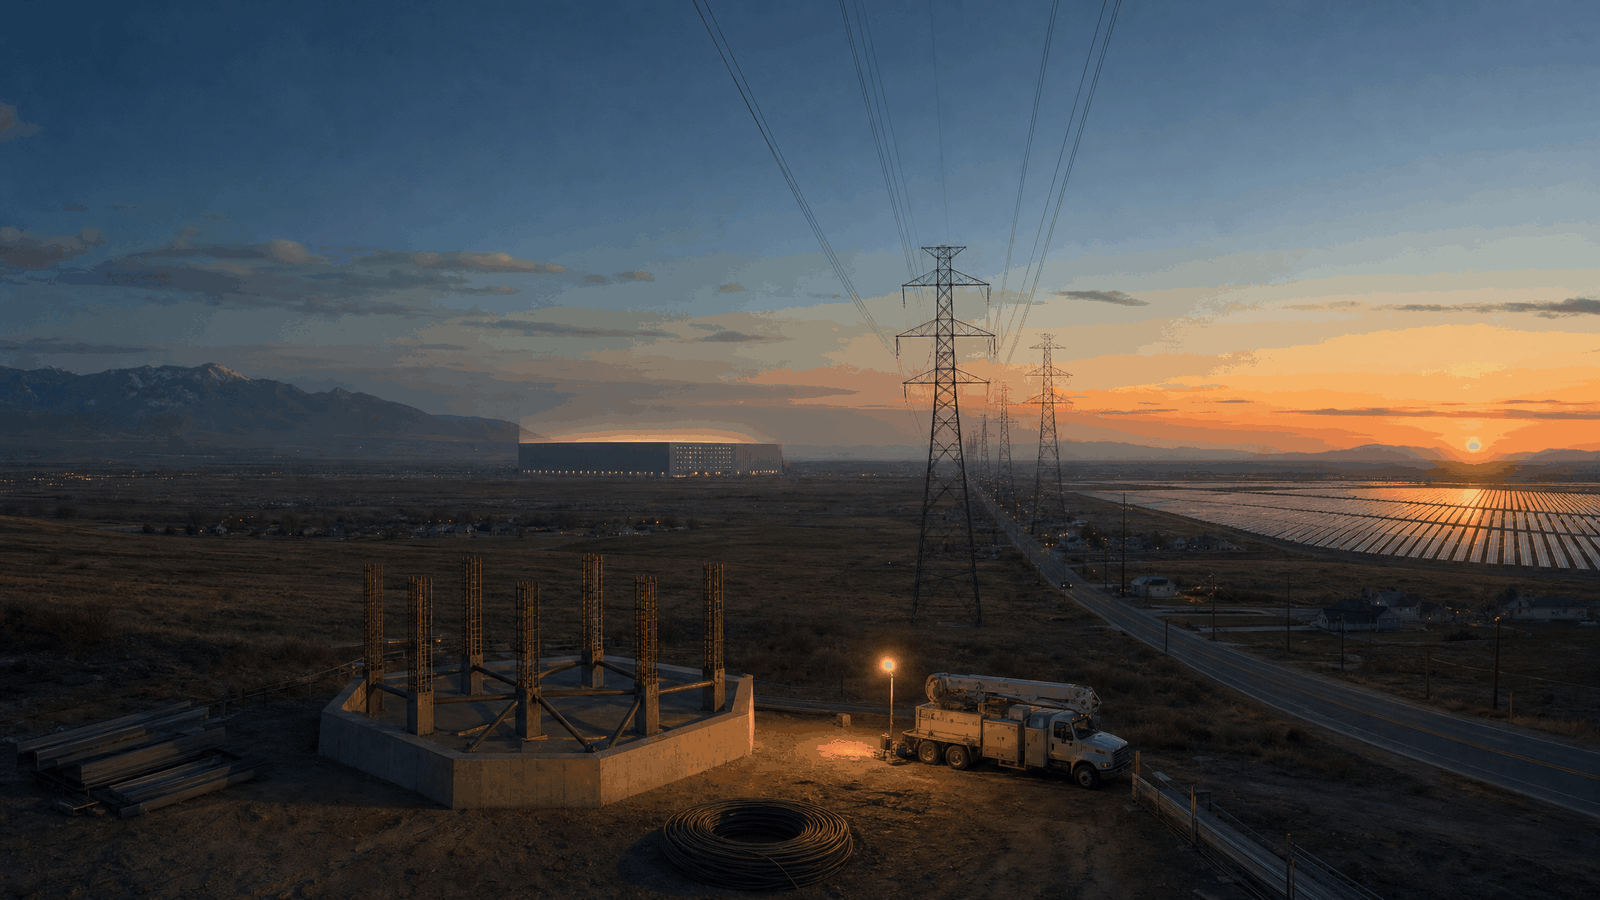
Listening notes on the 2026-09-17 AMA episode of Catalyst with Shayle Kann: why the data center backlash crossed party lines, how much the Iran war moved EV sales, why fuel cells caught the AI power wave, why solar forecasts keep coming in low, and why the grid is underrated. Educational commentary, not investment advice; companies mentioned are examples only.
Contents
Such things do not happen in a single morning or evening; what brings them about accumulates by degrees.
—— I Ching, Kun Hexagram, Wenyan Commentary (pre-Qin; translated by the author)
What this episode is about
The September 17, 2026 episode of Catalyst with Shayle Kann is an AMA. Producer Max Savage Levenson, usually behind the scenes, stepped up to the mic with his own questions plus a few from listeners. Shayle, an early-stage investor at Energy Impact Partners, looked back at what surprised him in 2026 so far and at what he is watching next.
The topics range widely: data center backlash, the Iran war, fuel cells, electricity subsidies, solar forecasts, the grid. One thread ties them together for me: people keep misjudging how fast things move in energy, and in which direction. The backlash came faster than expected, the war moved EVs less than expected, solar keeps outgrowing forecasts, and the grid starts slow but has more momentum than the market assumes.

Key takeaways
1. The data center backlash arrived fast, and it is bipartisan. What surprised Shayle most was the speed and the cross-party nature of the opposition. New York and Texas both have some version of a pause. You would expect the left to lead, and Bernie Sanders is the loudest: as AI leaders debated pacing development, he said pacing is not enough, it needs to stop. The right is upset too. His read: politics are local, communities are unhappy regardless of party, and a general AI anxiety sits on top. At the national level, President Trump is about the only voice saying not to worry.
2. The backlash will slow the buildout, but it will not stop frontier AI. Texas is his example: large loads will still get built, but the process Governor Abbott pushed through is already causing delays, more like six months to a year than five years. Relative to a world with no guardrails, less gets built. If anything slows frontier AI, it is more likely the regulatory body some AI leaders are asking for.
3. The Iran war had a limited direct effect on EVs. Early talk of $200 oil did not pan out; oil sat around $100 at recording. Oil prices and EV adoption are only weakly correlated. Outside Europe and the US, EV sales doubled this year. Europe grew 29%, in line with its trend. The US fell 21%, mostly because the tax credits disappeared, which swamped any war effect.

4. The underreported effect is European energy sovereignty. The Russia-Ukraine war started it and the Iran war cemented it: Europe no longer wants to be a perennial net importer. Defense spending is the visible side; energy strategy is the quieter one, with tailwinds for anything domestic or regional. He expects this to matter a lot, slowly.
5. Bloom Energy’s story is under-told. He notes the company was valued at around $50 billion recently and $80 billion at one point, so “underdog” does not fit, yet few people talk about why. In the AI power rush, every gas turbine that can be bought is being bought. Next in line is equipment with lots of operating data, and fuel cells qualify, with easier air permitting on top, which is becoming a major barrier. The company predates the first clean tech cycle, rode it up and down, and sat as a small cap for years before this wave arrived. One detail worth noting: Bloom Energy is among this episode’s sponsors.
6. He is watching for a data center that subsidizes everyone else’s power bill. Last time he had not run the math; now he has, and it works in a small utility territory. Picture a 3-gigawatt peak system adding a 1-gigawatt data center: given expected revenue and margins at gigascale, a 20% to 50% subsidy for every customer pencils out. A politician in Ohio has proposed subsidizing rates to zero statewide; he doubts that at state scale but finds it plausible in small territories. The hard parts are finding a site and energizing fast, what he calls a unicorn set of circumstances.

7. Bet the over on solar, and give the grid more credit. The latest SEIA and Wood Mackenzie outlook says this year’s surge reflects a rush before tax credits expire, followed by a flat rest of the decade. Shayle has high confidence it will not be flat: generation is needed, most new projects pair with batteries, solar deploys fast, domestic manufacturing is expanding enough to absorb tariffs, and inflation hits every source while gas supply chains are more gummed up. His hot take: utilities run multi-year planning cycles with regulators, those gears only started turning in the last couple of years, and two years from now the grid will add more capacity than in any year since before 2000, possibly decades before that.

Further thoughts
The forecaster says flat, the host says record highs. Who do I believe?
When two claims collide, my instinct is to ask who has more authority. This episode suggested another route: check which way a forecast has missed before.
Shayle’s first argument is a base rate. For about twenty years, mainstream forecasts, US and global, have underestimated solar build almost every year. If a forecast’s errors are random, its midpoint is usable. If the errors lean one way, the midpoint should shift that way.

Step two is finding the assumption that drives the number. “Flat” comes from treating this year as inflated by a pre-expiration rush that fades once the credits go. Shayle attacks that assumption: storage pairing, manufacturing growth, and gas supply constraints do not depend on subsidies.
Step three, the one I forget most, is writing the failure condition. His case relies on domestic manufacturing coming online and tariffs staying manageable. If capacity slips and imported module costs climb, the bet needs recalculating. He is also candid that commercial and industrial solar has fizzled: stuck between residential standardization and utility-scale spreading of costs, it gets the worst of both. It would take better economics plus AI cutting soft costs close to zero. Someone bullish on solar who still says one segment is not working makes me trust the main argument more.

This company has been hot for a while. Am I too late?
The Bloom Energy segment stuck with me. The company has existed for over two decades, and its technology did not get better last year. What changed is where the bottleneck sits.
Seen through bottlenecks: AI data centers need power fast. Grid queues are long, so builders go behind the meter. Turbines are sold out, so the constraint moves to what equipment has enough operating history and can get permitted. At that layer, a company that survived the last cycle with years of field data ends up standing on the choke point.

What I take away: instead of asking “am I too late,” I ask “how long will the bottleneck it solves stay tight?” Bottlenecks move. If turbine supply catches up and the grid’s gears turn as Shayle expects, the speed-to-power constraint loosens, so it matters which time window a valuation is pricing in. Also, when a show’s sponsor gets named the year’s unsung hero, I check primary sources before forming a view. That says nothing about the host’s integrity; it is a check I owe any source.
The headlines say the grid can’t keep up. Is everyone going to self-generate?
This narrative is everywhere lately, and Shayle’s hot take lands right on it.
I think about it in two layers. First, noise versus structure: the grid is slow, but the slowness lives in decision cycles. Utilities file resource plans, regulators review, contracts follow, and a round takes years. Slow systems look stalled before they start and are hard to stop once running. Second, timing: headlines describe the last two years, while Shayle says the gears only just started turning and the output shows up two years out.

Both can be true. He expects plenty of behind-the-meter capacity too; he just thinks the grid’s share is underrated. My own check: when I hear “industry X can’t keep up,” I look up how long that industry’s decision cycle is and where in the cycle it sits now. Falling behind at the start of a cycle and failing to deliver at the end of one are different situations.
References
- Catalyst with Shayle Kann, “AMA: Fuel cells, geopolitics, and the solar growth curve,” Latitude Media, 2026-09-17
- SEIA and Wood Mackenzie, US Solar Market Insight quarterly outlook
- Utility integrated resource plans (IRPs) published through state public utility commissions
One thing to take with you
Forecast errors often lean in one direction, and knowing that direction is more useful than knowing who made the forecast.
One thing I have tried: pick an estimate you rely on every week, like “this commute takes 30 minutes,” “this report takes two days,” or “groceries cost $250 this month.” Look up the last five actual results and write one word next to each: “over” or “under.” If four of the five share a word, add a buffer in that direction next time, then log five more and see whether the gap shrinks.
This article is an educational discussion of investment method. It is not advice to buy or sell any individual security, offers no target prices, and does not analyze any current holding. Investing carries risk; make your own decisions or consult a qualified professional.